Taking a Crack at Locky

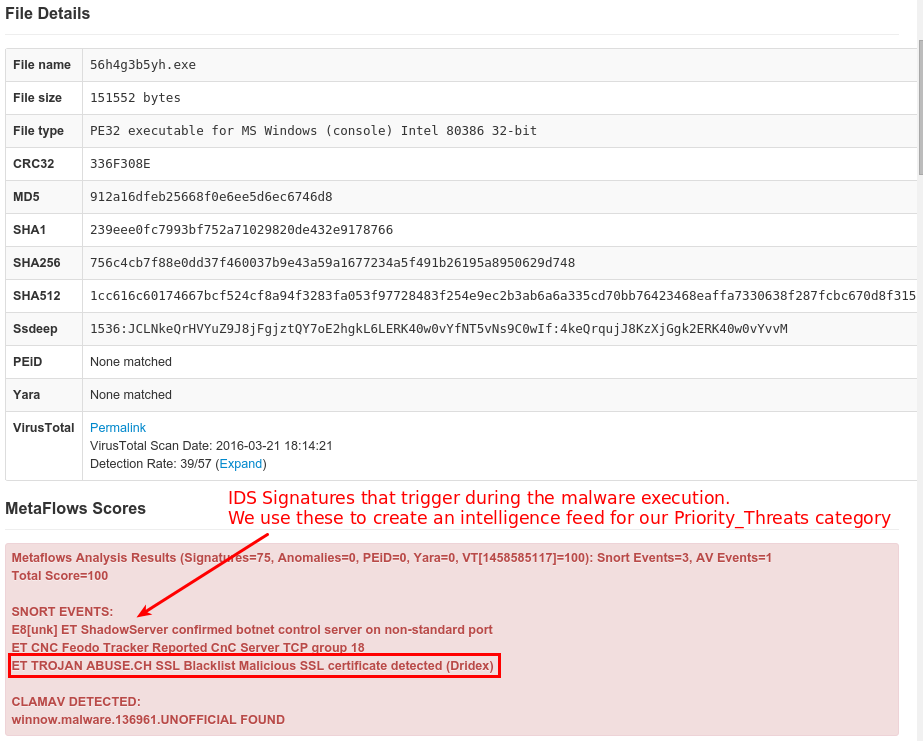
Since mid-February, security researchers have been encountering Locky, the latest ransomware tool in the adversary’s arsenal. The engineers at MetaFlows observe Locky primarily in email attachments that are processed using the MetaFlows sandbox. On networks being monitored by MetaFlows sensors, the engineers are able to take samples of inbound .zip email attachments and send them to a Cuckoo Sandbox to be processed. The sandbox runs the sample in a virtual machine and is able to detect malicious behavior. Often malware tries to evade detection, but since Locky is trying to get noticed by the user anyway, it is not subtle. Locky typically triggers over a dozen indicators of compromise and IDS signatures on the sandbox and therefore, is almost impossible to miss.

MetaFlows has seen consistent spam campaigns over the last month that deliver zipped JavaScript files that Windows is designed to execute by default with its native wscript.exe. The files, when executed by the user, appear to do nothing at first. This is a bad sign. Within moments a secondary payload is fetched, encryption has begun, and command and control beaconing has been performed in the background. Once it is done, the user will be greeted with the typical ransomware demands webpage, image, and wallpaper.

Selection_010.pngSelection_009.png

The spam campaigns use short, simple subject lines, or they include only “Re:” or “Fw:”. They are often appeals to business or tax related concerns, and the body is usually curt with a reasonable request to review the attachment and respond. These emails frequently include a legitimate appearing signature and use appropriate spelling and grammar. It is easy to see that people who are not constantly on guard about these issues could easily be tricked into opening the file. In the example below, the target could be concerned that they or their business missed a legitimate payment, or knowing that they have no business with “China Information Technology, Inc.,” they may open it to investigate why they have been billed.

Screen Shot 2016-05-19 at 3.36.44 PM.png

The engineers at MetaFlows also collect statistics on the email subjects used to lure victims into opening the attachments, these are part of the Weekly Statistics page. The subjects vary from scare tactics, to just curiosity, to near gibberish, but they are rarely outlandish or over-the-top as spam quite often is. Not all of these are Locky, but the vast majority those that have made an appearance this week are.

Enterprises can make themselves less of a target by employing a two-layer approach. Investing in an IDS such as MetaFlows that will detect the inbound file, and recognize the infection behavior of a compromised system is the first layer. Given the current view on the spam campaigns distributing ransomware, the best solution is user education. Staff members should be approached, reminded regularly of this problem, and ideally possess some healthy paranoia about opening email attachments unless they absolutely know the sender. Also, even though .doc and other common files can be vectors for infection as well. Most users have no reason to ever open a .js with a strange icon.

The next layer consists of getting user files out of the path of Locky and other ransomware. While the campaigns we are seeing are spam based, ransomware has been previously documented coming from drive-by sites and browser exploits, so even a user savvy to email attachments could still get hit. Users should make secondary backups of important files part of the daily work-flow. Options for this can be summed up with three “C”s.

  • Copy files to a remote device. This is probably the best option, as long that remote device is not permanently connected to the user’s machine. Network shares that are mounted when Locky is executed will also be encrypted. Copying files to an ftp server manually (or as a scripted job for the advanced users out there) is probably the best bet.
  • Create a local backup directory. During experiments researching Locky, in which our engineers continuously re-infected virtual-machines (for science), MetaFlows engineers did find that it ignores the C:\Windows directory. Do not bank on this working forever, but for now it seems like users can make a local backup directory under C:\Windows\JustInCase. If Locky strikes, it will ignore files that are stored there. This is probably the riskiest option since the malware may change its behavior at any time, but it is a clever one to use in the short-term. Of course, it also requires administrator privileges.
  • Consider using USB storage. This a fantastic solution, except that people forget to unplug them once they are done backing up files. Users can plug in an external drive or usb stick, backup all necessary files, then unplug it again and Locky cannot touch it. However, if it is left it plugged in, these backups will all get encrypted just like a mounted network share.

In conclusion, Locky, like all ransomware, is a peril for all users. However, like all problems, there are solutions. Employing the MetaFlows IDS, maintaining backups, and investing in education are three of the most important tools one can use to prevent adversaries from succeeding.

Feature Highlight: Snort Rule Editor

Recently, the Snort Rule Editor as a part of the Rules Management Interface has been updated. This redesign allows for increased flexibility and provides the user with more of a handle on the IPS rules settings.

How It Works

Entering the Rules Management Interface is easy and can be accessed from two possible locations. From the View Sensors page, the user can select the Edit Rules link to enter the Rules Management Interface. The user can also navigate to the Rules Management Interface from the Main Menu link.

Upon selecting the Rules Management Interface, the user will be prompted to select a sensor from the dropdown and then choosing the Load Rules button. From there, the user will be able to manage the rule sets on a sensor-by-sensor basis.

Selection_003

After selecting a sensor, the user will have the option to modify properties of the rule sets, and issue commands to the sensors with the tools on the Menu Bar. In order for the changes made in the rules interface to take effect, commit the changes using the Save button. (Please note that the Save/Cancel options only appear if the rules have been modified.) After selecting the Save option, a window will appear indicating that the changes are being verified. This process ensures that there are no issues with any changes that were made to the rule sets and that the sensor will correctly load the rules. Once the Save process is finished, the user will be prompted to reload the sensor.

To update the rule files, select the Get Updates button on the Snort Rules Controls. Most of the sensor controls buttons will be disabled/greyed out, and the Get Updates button will have a spinner icon until the update process finishes. Next, the page will refresh to indicate if the updates were applied successfully. After the Get Updates process completes, select to Save the changes and Reload the sensor configuration for the changes to take effect.

Get_updates_1Get_updates_2

The Rule File List portion of the interface displays a complete listing of all the rule sets in the sensor configuration. The local.rules file contains the pass rules (if any) that have been generated using the Tune IDS feature and any rules that were uploaded by the user.

Rules_listings_per_file

In the Rule List, each rule can be enabled or disabled by selecting the checkbox under the Active column next to each rule. If the checkbox under the Drop column next to a rule is checked, the sensor will drop flows that trigger the rule. Although we only recommend it for advanced users, each specific rule can also be edited by clicking on the rule itself. This will open the Rule Editor window, displaying the original rule, the editor, and some statistics that have been collected for that rule. Advanced Snort users can use the Rule Editor to make changes to the content of individual rules. When modifications are made, the Diff section will show changes to a rule since the most recent Save of the rule sets.

Manual_rule_editor

Pass Rules inform the IDS system that packet matching these rules should not generate alerts. These are helpful for eliminating false positives without having to disable the offending rule altogether. The Pass Rules have system-generated SIDs so that they do not conflict with the original rules that to which they refer. The user can utilize the tuning interface to add pass rules to the local.rules file. Please remember to Save any changes to the rule sets through the Rules Management Interface.

Selection_004

For users that want to run a reduced rule set for performance reasons, there is an Automatic Tuning option under the Bulk Edit menu. This option will disable rules that are unlikely to trigger based on our observations across all customer networks. After clicking on the Automatic Tuning option, the changes will be merged with any prior changes that have made, meaning that rules that have specifically enabled will stay enabled. If the user wants to revert to a default minimal set, they should consider first using the Rules Defaults option. Once the Automatic Tuning has processed the rules, it will then automatically fetch the latest updates and disable all of the appropriate rules. To complete this process, the user will need to select Save so that the changes are committed.

Full color images and even more detailed instructions regarding The Rules Management Interface can found in the MetaFlows Wiki.

Uncovering True Positives

MetaFlows is now using our sandbox results as an intelligence feed for ranking events. This method of using the sandbox as an intelligence source for ranking signatures allows us to catch infections or high-risk behavior, even if we only see one piece of the traditional malware life cycle. The picture below illustrates a sandbox report that shows where the signature was first observed in association with malware.

Selection_002

How It Works

Individual IDS signatures can now be ranked as a priority threat if they have been triggering inside the MetaFlows sandbox in association with malware. These signatures are only considered for special ranking if they are statistically rare among events across all MetaFlows monitored networks. Given their nature, these events are likely to missed by an analyst among the many other events that may be normally low ranked. The image below displays a ranked event on the user’s dashboard showing an alert identified with the new threat category.

Selection_001

You can see what kinds of events are triggering in the MetaFlows sandbox by visiting our statistics page.

FireEye Foibles

On February 15th, Blue Frost Security released a statement regarding an analysis engine evasion that was identified in regards to FireEye’s virtualization-based dynamic analysis. Their statement reads, “An analysis engine evasion was identified which allows an attacker to completely bypass FireEye’s virtualization-based dynamic analysis on Windows and whitelist arbitrary malicious binaries.”

We now have a signature to detect this method of evading FireEye:

2022554 || ET EXPLOIT FireEye Detection Evasion %temp% attempt – Inbound ||

Any customers who are also using the FireEye system may want to set up additional rank or email classes for this rule so that they can be alerted to malware that may be attempting to bypass their FireEye appliance. FireEye has released an update for this that users should apply immediately, if they have not done so already. However, even once the issue has been patched, seeing the attempt of this bypass can be a valuable indicator of malicious activity on its own. This may be tried alongside future evasion attempts.

Predictive Global Correlation Feed

After months of data gathering, we turned on a new global correlation feature that complements the existing local multi-session correlation. The aim is to further tighten the net and catch more bad stuff while also decreasing false positives.

We now show the ranking as total/global when we display an alert. When the global ranking is missing, it is because that event is only ranked locally and the global portion is unknown. When the total and global rank are the same (like 187/187 in the example below), it means that an event was ranked exclusively using global relevance and it would have been missed by the local analysis.

You can see the global ranks by going to the IDS rule management interface. IDS rules listed there will have the current global rank assigned to them for that day (if any).

blog

This additional information complements the local multi-session correlation analysis by trying to look at things from a global intra-domain prospective:

If a domain similar to yours has experienced a significant amounts of high-priority network security incidents involving a particular IDS signature, that signature will receive a positive global rank in your domain.

The key here is the word “similar”. The events each customer generates are used to compute a similarity matrix that tells us how similar each network is to the others. Using this information, rather than recommending all high-priority signatures to all domains (we call this simple prediction), we only recommend what is most likely relevant to your domain (we call it predictive correlation).


Let us know how this works for you and if you have any questions.

Thanks!

The Skinny on CVE-2015-7547

While the DNS exploit CVE-2015-7547 was discovered a week ago, the code containing the flaw has been in use since May, 2008. CVE-2015-7547 works by allowing arbitrary code to execute on any system reliant on glibc by way of a malformed query response. As discovered by Redhat Linux and Google, there are flaws in GNU C Library. The GNU C Library connects to DNS to resolve names. This problematic code effects all versions of glbc since 2.9 and allows for remote code execution.

We have seven signatures, the first of which was released the day after the exploit was discovered. We were able to push the beta version of the rule to our research partners immediately, and to all sensors during the normal daily signature update.

2022531 || ET EXPLOIT Possible 2015-7547 Malformed Server response || cve,2015-7547

2022542 || ET EXPLOIT Possible 2015-7547 PoC Server Response || cve,2015-7547

2022543 || ET EXPLOIT Possible CVE-2015-7547 Long Response to A lookup || cve,2015-7547

2022544 || ET EXPLOIT Possible CVE-2015-7547 Long Response to AAAA lookup || cve,2015-7547

2022545 || ET EXPLOIT Possible CVE-2015-7547 Malformed Server Response A/AAAA || cve,2015-7547

2022546 || ET EXPLOIT Possible CVE-2015-7547 A/AAAA Record Lookup Possible Forced FallBack(fb set) || cve,2015-7547

2022547 || ET EXPLOIT Possible CVE-2015-7547 Large Response to A/AAAA query || cve,2015-7547

Signature 2022547 is currently triggering on multiple customer sites, but at least for now it is in low volume. However, according to Dan Kaminsky, this is a threat that could swiftly escalate as more and more adversaries improve their attack strategies to increase the damage made possible by CVE-2015-7547. Patching this particular bug is paramount, as well as continually monitoring your system for the exploit.


Measured Antivirus Effectiveness

I wanted to share with you some insight from the data that originated from our customers’ networks last week. This time, we wanted to provide some information on how different antivirus vendors perform on the .exe, .dll, .pdf, and .zip files seen around the world.

This table shows the relative hit ratio of all the antivirus vendors hosted by Virus Total on 697 confirmed bad files. You will notice that 43% of the time none of the antivirus products detected anything. The top performer is McAfee-GW-Edition with a 37% detection rate.

Looking at the types of samples detected, one can also consider which Antivirus Vendors were able catch the worst malicious code. We assigned an Average Priority of 1 to spyware or unwanted software and an Average Priority of 100 to known Trojans or unclassified malware. Then, we multiplyed the Average Priority by the Detection Rate, giving rise to the Severity column. This column shows which Antivirus Vendors found the most dangerous code. This week Arcabit wins with a Detection Rate of 29%, an Average Priority of 30.17, and a Severity of 8.96.

Antivirus Vendor True Positives Average Priority Detection Rate Severity
None 300 0.430416 (mss)
Arcabit 207 30.17 0.296987 8.96
F-Secure 192 28.84 0.275466 7.95
ESET-NOD32 205 24.18 0.294118 7.11
AVG 129 37.07 0.185079 6.86
Avast 200 23.77 0.286944 6.82
Qihoo-360 207 22.52 0.296987 6.69
GData 223 20.09 0.319943 6.43
McAfee-GW-Edition 264 16.75 0.378766 6.34
CAT-QuickHeal 162 27.28 0.232425 6.34
VIPRE 172 23.45 0.246772 5.79
Cyren 201 19.72 0.288379 5.69
Panda 85 46.42 0.121951 5.66
F-Prot 160 24.51 0.229555 5.63
ClamAV 62 63.27 0.088953 5.63
Fortinet 105 29.29 0.150646 4.41
McAfee 117 25.54 0.167862 4.29
Avira 210 12.79 0.301291 3.85
Bkav 83 30.82 0.119082 3.67
MicroWorld-eScan 162 15.06 0.232425 3.50
BitDefender 161 15.14 0.230990 3.50
Emsisoft 160 15.23 0.229555 3.50
CMC 24 100.00 0.034433 3.44
Kaspersky 86 27.48 0.123386 3.39
TrendMicro 63 37.14 0.090387 3.36
Ad-Aware 140 16.56 0.200861 3.33
Ikarus 209 10.95 0.299857 3.28
AVware 95 23.93 0.136298 3.26
Comodo 69 26.83 0.098996 2.66
Sophos 77 20.29 0.110473 2.24
Rising 195 7.09 0.279770 1.98
Tencent 50 24.76 0.071736 1.78
ALYac 108 9.25 0.154950 1.43
Microsoft 25 36.64 0.035868 1.31
K7AntiVirus 109 5.54 0.156385 0.87
DrWeb 134 3.96 0.192253 0.76
Malwarebytes 222 1.89 0.318508 0.60
K7GW 120 3.48 0.172166 0.60
Antiy-AVL 74 5.01 0.106169 0.53
Symantec 161 1.61 0.230990 0.37
VBA32 53 4.74 0.076040 0.36
nProtect 16 13.38 0.022956 0.31
NANO-Antivirus 76 2.30 0.109039 0.25
SUPERAntiSpyware 38 3.61 0.054519 0.20
Jiangmin 38 3.61 0.054519 0.20
Zillya 131 1.00 0.187948 0.19
ByteHero 4 25.75 0.005739 0.15
Baidu-International 83 1.00 0.119082 0.12
AhnLab-V3 80 1.00 0.114778 0.11
Agnitum 57 1.00 0.081779 0.08
ViRobot 12 1.00 0.017217 0.02
AegisLab 9 1.00 0.012912 0.01
TotalDefense 2 1.00 0.002869 0.00
Zoner 1 1.00 0.001435 0.00
Alibaba 1 1.00 0.001435 0.00

Our sandbox was able to detect the remaining samples (the missing 43%).

antivirus

The bubble graph above illusrates the Severity (Detection Rate * Average Priority) verses the Prevalence (Detection Rate * Total Priority). The detection rate is encoded in color and the size of the bubble is proportional to how many customers saw the malware.


If you are curious about more statistics like this, you can visit https://www.metaflows.com/stats/ (best viewed on a desktop) for a ton of additional information. If you want a quick fix, watch some of our videos at https://www.metaflows.com/saas/.

The Raw Data

We wanted to share with you some insight from the 50M+ security events that originated from our customers’ networks last week. We reported different security event invariants that were confirmed to be true positives and how they fit within a global, multi-domain context. The data and several interesting graphs can be obtained at https://www.metaflows.com/stats (best viewed on a desktop).

12.14.15 Image 1

For example, the top OpenAppIDs that were the best predictors of a compromise last week are shown below. Interestingly, we also detected that the google_update OpenAppID predicts with fifty percent (50%) accuracy malware activity designed to evade application firewalls. Remember, these are actual measurements across 50M+ records. As a result, they should be relevant to any network.


Table

Below is a visualization of the IDS rules with greater than 95% accuracy last week. Please visit our stats page at https://www.metaflows.com/stats/ for more detailed information.

12.14.15 Image 2

MetaFlows offers a compelling product that will provide an unprecedented level of protection to any network. If you decide to run a trial, in addition to automated incident reports with extremely low false positive rates, you will also get a personalized multi-domain report for the events found on your network.

User to IP Address Mapping Through Active Directory

We have added support for extracting successful user logins through MS Active Directory for Silver and Gold subscriptions. You can now install a MetaFlows agent (nsm_logc) on your Active Directory servers to export Windows logs to your sensor(s). The agent will also export other critical Windows events to the sensor so that you can record that information and perhaps correlate it with other security events. Although we recommend installing the MetaFlows agent nsm_logc, this mechanism will also work if you install Snare (commercial) or eventlog-to-syslog (open source) instead of nsm_logc. One advantage of nsm_logc is that the logs are exported through an encrypted channel rather than being sent in clear text.

In any case, the end result will be that any time a user logs in from a specific IP Address, (1) a real-time service discovery alert is generated and logged, and (2) his/her identity is associated with any alert which involves that IP Address. The user identity is appended to the alert messages and is therefore searchable as any other string. Information on how to install the AD agents and some screen shots are here.

As always, do not hesitate to contact us if you have any questions or if you encounter any problems implementing this exciting new feature.

Happy Hunting!

The MetaFlows Team

Command Line Interface Is Here!

As a new feature to the MetaFlows MSS, we have added the ability to query the MSS for both historical flow data (with payload coming from the sensor) and historical event data (coming from our data base). The flow data text output can be formatted to look like what Argus provides (-f -X) or what Bro provides (-c), depending on the options that are selected. We have also added JSON output (-J) for those of you that use Splunk, and want to do some integration work. The MetaFlows Wiki has been deeply revamped and the CLI documentation is at:

https://docs.metaflows.com/Command_Line_InterfaceScreen Shot 2015-09-14 at 4.33.05 PM

The CLI client is written in Perl and can be copied to any system after initialization – so you may execute the CLI queries from any host. Also, if you dare, you can modify the Perl code to change the output formats or to add your own command line switches.

To wet your appetite, the following query will return all the latest malicious content from your sensors:

getflows.pl -u api1:xxxx -B

This query, for example, shows all of the clients on your network attacking Chinese Web Servers:

getflows.pl -E -u api1:xxxx -w 360000 -Q modsec_out | grep CRITICAL | grep :CN

We encourage you to invest some time in looking at this CLI interface. As always, do not hesitate to drop us a line at support@metaflows.com.

Thanks!

The MetaFlows Team